Omnis Technical Note TNJS0006April 2016
Debugging JavaScript Client Methods
for Omnis Studio 6.0 or above
By Jason Gissing, Omnis Engineering
Methods in a JavaScript Client remote form can be set to execute on the client by right-clicking the method name in the editor and selecting the Execute On Client option - such methods are described as "Client Methods". When a method is client-executed, Omnis parses the code and compiles it into JavaScript when you save the class.
The advantages of executing your code on the client are that it should generally be much quicker, it reduces the load on your Omnis Server, and allows you to write pure JavaScript code using the JavaScript: command, allowing you to go beyond the functionality built in to Omnis.
However, as the code is executed on the client, it’s not possible to debug it using the Omnis debugger. In order to debug your client methods, you need to use your web browser’s debugger to debug the compiled JavaScript. Even if you are not familiar with JavaScript, you should still be able to use this process to see where an issue is occurring, and will often see how you can avoid it.
We suggest that Chrome has the best developer tools, and it is cross-platform, so is what we use in this tech note. The same principles apply to other browsers and their dev tools though.
The Process:
- Open your remote form in Chrome.
- Open the Chrome Dev Tools (Shortcut key is Ctrl-Shift-i or Cmd-Alt-i).
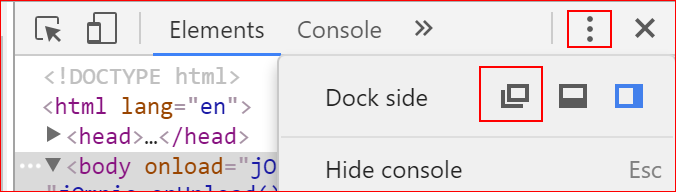
If the dev tools open inside your main Chrome window, you may like to undock it to a separate window, to give you more space.- Open the menu (3 dots) at the top-right of the Dev Tools window, and change the Dock Side option.
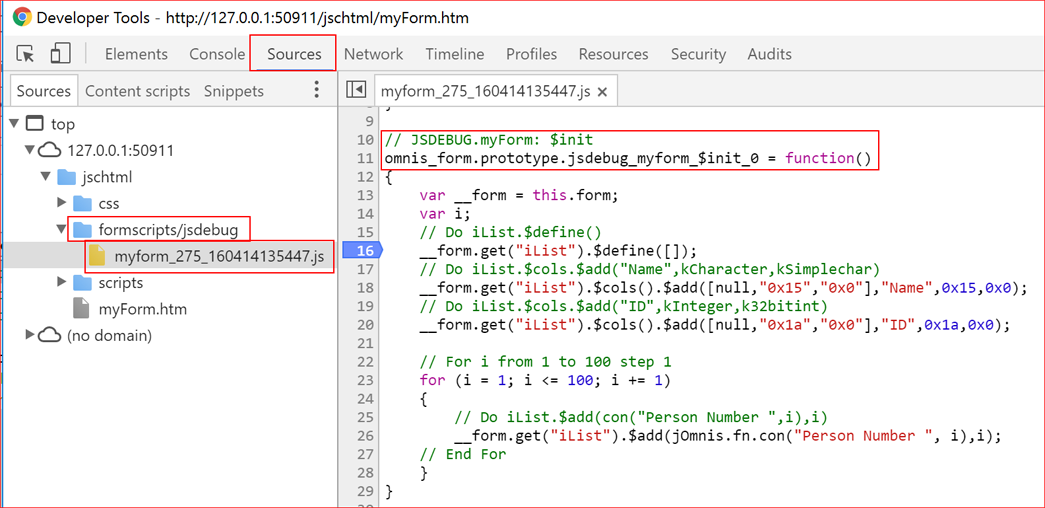
- Select the Sources tab.
- View the Sources in the navigator sidebar:
There will be a folder named formscripts/<Library Name>, which contains the JavaScript files for your library.
There will be a .js file within this for each form containing the client methods. - Select the .js file corresponding to your form (it will be named as your form, with random numbers appended).
You’ll see the .js file’s source in the main window. You can see here that each line of JavaScript code contains the Omnis code it maps to as a comment above it. - Scroll through the .js file’s contents in the main window to find the method you wish to debug.
It will be named using the format: omn_form.prototype.<Library Name>_<formName>_<Method Name>_<Number>
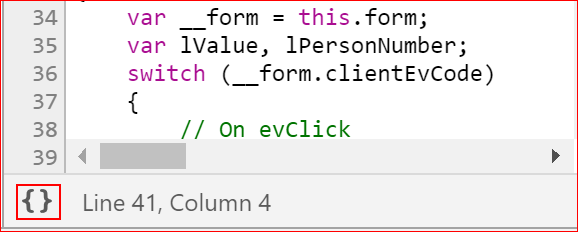
- Click the line number next to a line to add a breakpoint.
You can right-click the breakpoint and select Edit Breakpoint to allow you to set a condition (using JavaScript) which must evaluate to a ‘truthy’ value for the breakpoint to be hit - useful if the line is going to be hit lots of times, e.g. in the screenshot above, if you had a breakpoint inside the for loop, you could set its condition to be i == 90 so it only breaks when it’s on the 90th iteration of the loop. - Now cause your method to be called - it should hit your breakpoint.
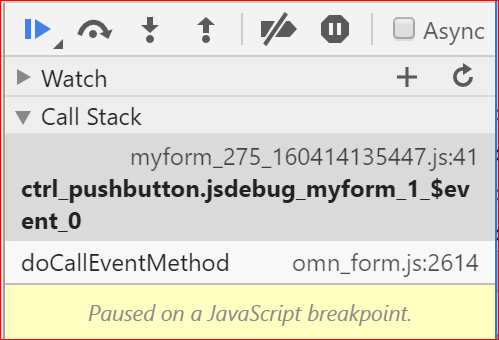
- Mouse over a variable to view its value.
The Debugger sidebar on the right of the window contains buttons at the top to step through the code etc. It also contains a Call Stack so you can see the stack trace that led to this point.
Further Tips:
Prettify Minified Code:
If you step into code which is part of the JavaScript Client, you will see that it is minified, with white space removed, making it difficult to step through and debug. The Chrome debugger provides a Pretty Print button underneath the source window, which will reformat the minified code into a more readable, and debuggable, format.
While you shouldn’t change the JavaScript Client code yourself (please file a bug with Support), it may be useful for you to step through the code to see why, or what part of your input is causing an issue.
Break On Exceptions:
If your code is causing an exception (you will generally see something added to the Dev tools Console, or an Omnis error dialog may be shown on the client, if this occurs), you can tell the debugger to automatically stop on the exception.
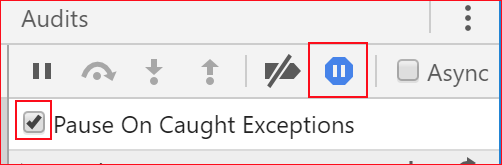
- Open the Sources tab of the dev tools.
- Click the ‘pause’ icon at the top of the debugger sidebar on the right, and enable Pause on Caught Exceptions.
When the page first loads you may hit two exceptions inside jQuery - these are fine to ignore, as jQuery is catching and handling these.

 Facebook
 Github
 Instagram
 Linkedin
 Twitter
 Youtube
 Please logon or create a free account to download this file.
